· By Ondrej Kavalek
4 Indicators You Should KNOW
Gain practical knowledge to better predict market movements
Technical indicators and oscillators are essential tools for any trader trying to effectively analyze the markets and improve their trading decisions. These tools not only help identify the current market trend and sentiment, but also make it easier to identify key turning points, entry and exit points. In this article, we will look at the most popular technical indicators and oscillators that are widely used in practice and provide you with practical tips on how to use them effectively to better predict market movements and time your trades correctly.
The most popular technical indicators
The most popular technical indicators include moving averages (SMA/EMA) and Bollinger bands. Moving averages help traders smooth price data and uncover underlying trends, while Bollinger bands provide information about volatility and potential turning points in the market. Of the oscillators, MACD (Moving Average Convergence Divergence) and RSI (Relative Strength Index) are often used to provide signals of possible overbought or oversold conditions in the market.
Each of these indicators and oscillators has specific characteristics and uses that can greatly affect the success of trading strategies. You will learn how to properly interpret the signals from these tools and how to incorporate them into your trading decisions. Using the Bollinger Band indicator as an example, we will show when it is appropriate to buy and when to sell, while the RSI oscillator will help us identify overbought and oversold markets.
Gain practical knowledge and take your trading skills to the next level. Understanding technical indicators and oscillators will give you the necessary tools to better predict market movements and to time your trades correctly.
Moving Averages
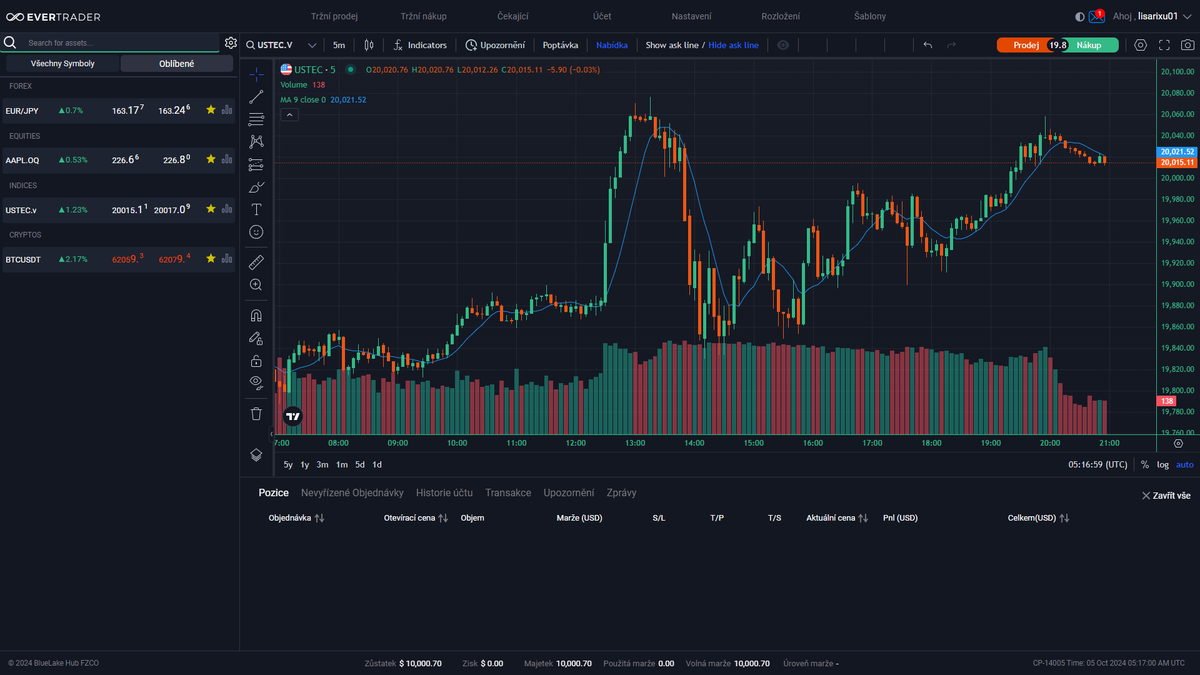
Moving Averages are statistical indicators that are used in technical analysis of financial markets to smooth price data. This helps to identify trends and patterns in price movements. The calculation of a moving average involves averaging price data over a period of time, which is constantly updated as new data comes in. This method eliminates short-term fluctuations, making it easier to spot longer-term directions in the price chart.
There are several types of moving averages, with the most well-known being the Simple Moving Average (SMA), the Exponential Moving Average (EMA) and the Weighted Moving Average (WMA). The SMA takes into account the arithmetic average of price data over a given period, while the EMA places more emphasis on the most recent data, thus reacting more quickly to price changes. The WMA assigns different weights to different data based on their importance or temporal relevance, allowing it to adapt to specific market conditions.
Moving averages are useful tools for traders who use them to identify trends, turning points and optimal entry and exit points from positions. They also help to detect trend changes early and can serve as supports or resistances in price charts. While moving averages provide valuable information, it is important to combine them with other technical indicators and analysis methods to minimize the risks of false signals and delayed reactions to market changes.
Bollinger bands
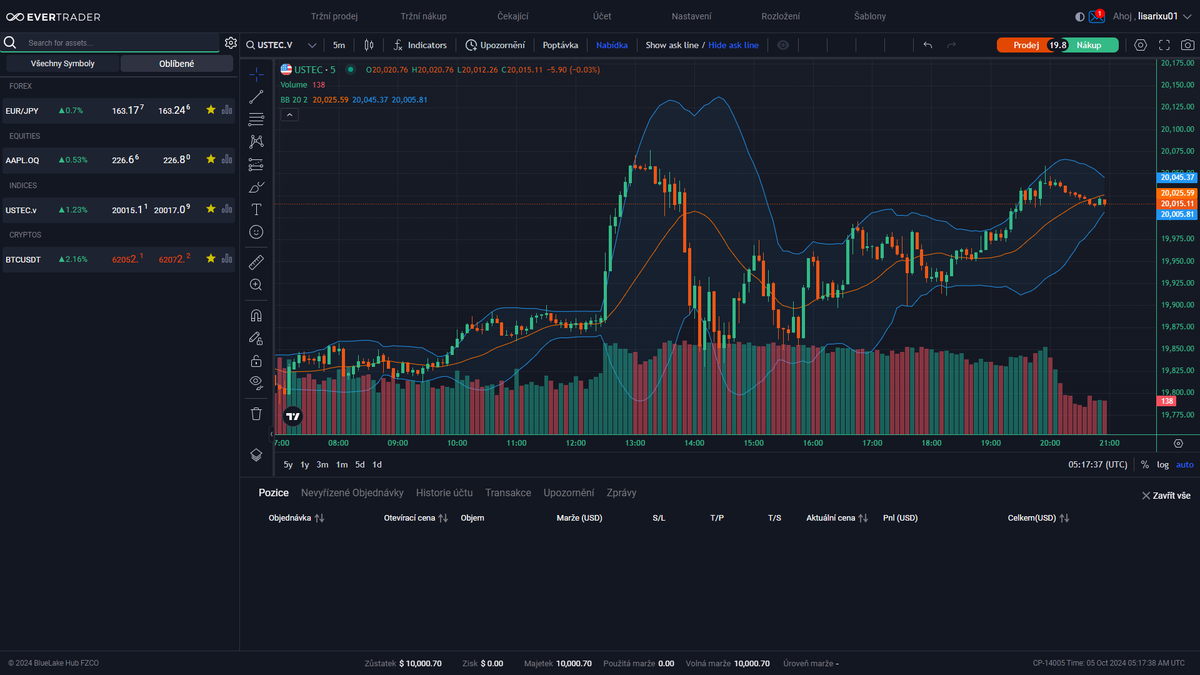
Bollinger bands are an indicator that was developed by John Bollinger and its primary purpose is to measure market volatility and provide traders with information about potential reversals and continuation of trends. Bollinger bands are made up of three lines: a center line (moving average) and two bands (upper and lower) that are placed around the center line based on standard deviation. The Bollinger bands are based on a 20-day moving average, which is the default setting, but each investor can customize them to suit their needs by choosing the length of the period and the type of average used (exponential, weighted, simple, etc.). The upper and lower bands are calculated using the standard deviation, which determines the degree of market volatility. The greater the volatility, the wider the bands, and vice versa. In a calm market environment, the bands are narrower.
MACD indicator
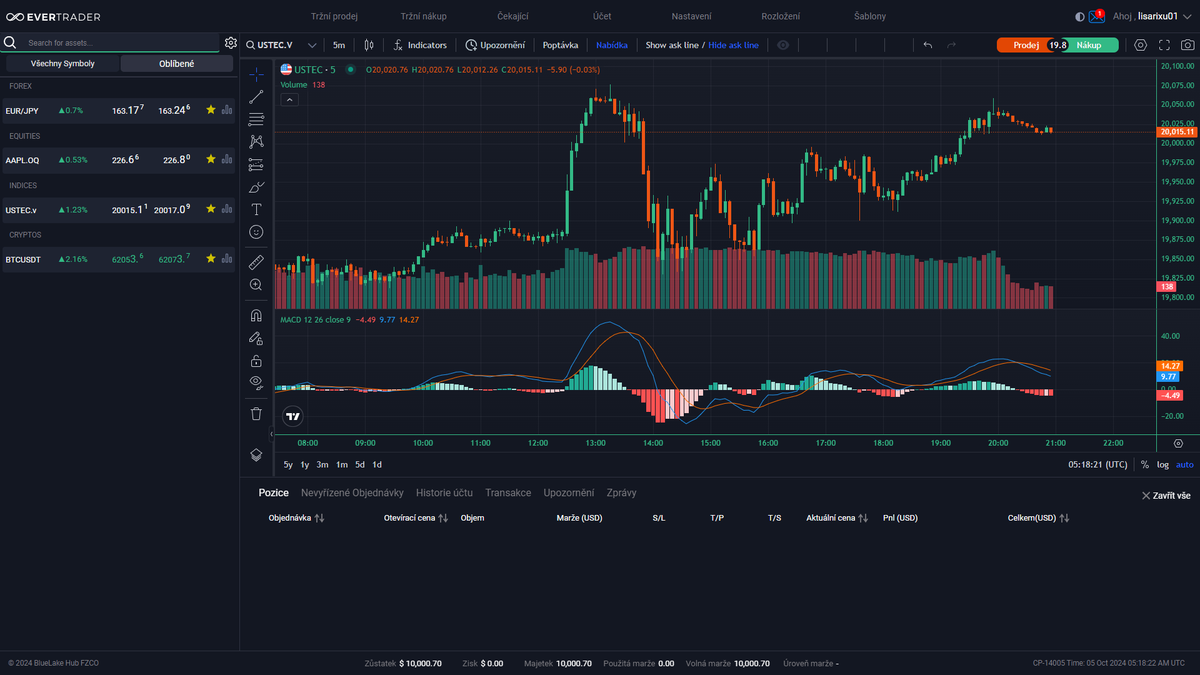
The MACD (Moving Average Convergence Divergence) indicator is an oscillator that measures the relationship between two moving averages of the price of a security, typically a long-term exponential moving average with a period of 26 and a short-term one with a period of 12. It consists of two lines and a histogram, where the main MACD line oscillates around the zero line, representing the long-term average, while the signal line (with a period of 9) helps generate trading signals. The histogram shows the difference between the main and signal lines, with values above the zero line indicating an uptrend and below the zero line indicating a downtrend.
MACD is a popular tool among traders due to its ability to visualize the direction and strength of the trend and generate trading signals. A buy signal is generated when the main line crosses the signal line upwards, while a sell signal occurs when the opposite crossing occurs. Divergences between price and histogram or MACD lines can additionally indicate potential trend reversals. Although the MACD is useful on its own, its effectiveness increases when combined with other technical analysis tools.
RSI indicator
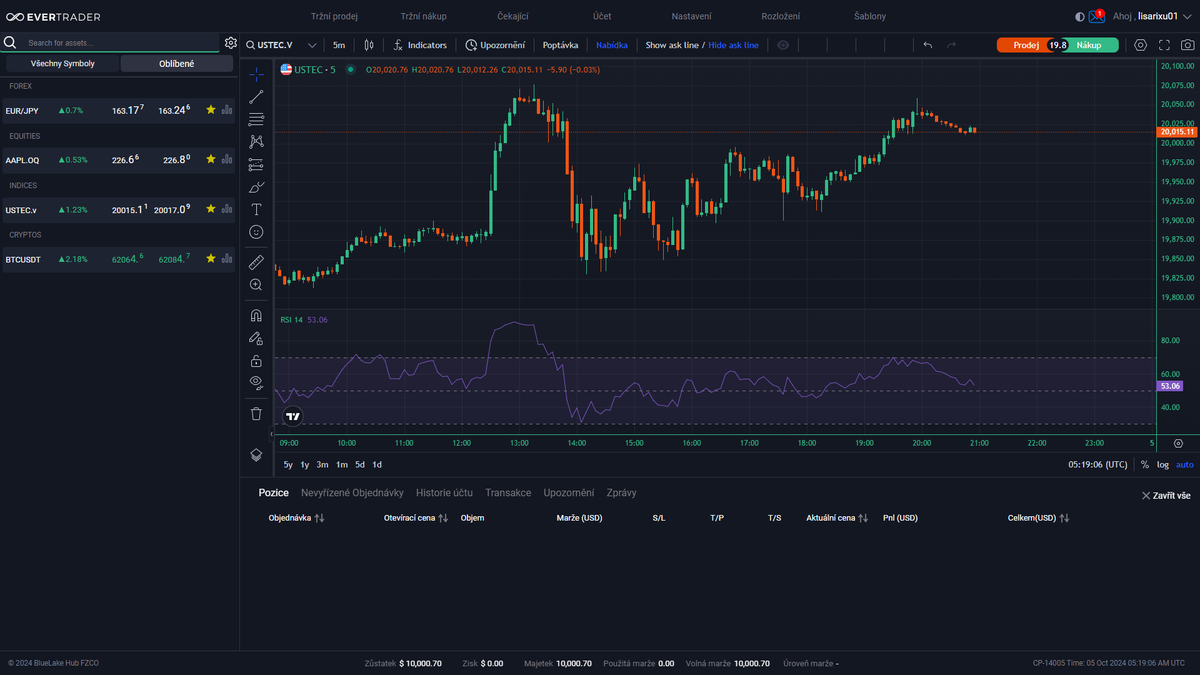
The RSI (Relative Strength Index) is one of the most popular technical indicators used to identify price reversals and trends in financial markets. This indicator measures the speed and strength of an asset’s price movement based on its closing prices in the last trading period and its values range from 0 to 100. The RSI is a versatile tool that allows traders to identify overbought and oversold areas, look for divergences between price and the indicator, identify chart patterning, draw trend lines and exploit swing reversal pattern failures.
Using RSI can be simple or complex, depending on the trader’s knowledge and his ability to combine this indicator with other technical analysis methods to confirm signals. The basic methods are monitoring readings above 70 (overbought) and below 30 (oversold) and looking for divergence when price and RSI show divergent trends. More advanced techniques include identifying patterns, drawing trend lines and using price to break out of a trading range. RSI is therefore an invaluable tool for effective trading in the financial markets.
Are you ready for successful trading with EverTrader?
If you just master these most popular technical indicators such as moving averages (SMA/EMA) and Bollinger bands, MACD (Moving Average Convergence Divergence) oscillators and RSI (Relative Strength Index), you can start trading immediately, as it is absolutely sufficient for technical analysis for successful trades.
Go through the EverTrader Verification and get all the tools needed to be a professional trader. We offer education and the opportunity to trade for a prop firm on EverAccount with a capital of up to 5 million CZK. Our EverStation Pro platform is integrated with TradingView and provides you with everything you need for successful trading.
Are you in?