· By Ondrej Kavalek
Basic principles of candle reading in trading

Why learn to read candles
Every successful trader needs to understand price charts – and the basics are candlesticks. These small rectangles with shadows on the charts hide a huge amount of information about market sentiment the strength of buyers and sellers and the possible direction of price.
If you want to trade professionally and have a clear understanding of what is happening in the markets, reading candles is absolutely essential.
What is a candle and what does it show?
Each candle on the chart represents price development in a specific time period (e.g. 1 minute, 1 hour, 1 day). It contains four fundamental values:
- Open (opening price) – the price at which the interval started.
- Close (closing price) – the price at which the interval ended.
- High (maximum) – the highest price achieved.
- Low (minimum) – the lowest price achieved.
The body and shadows of the candle
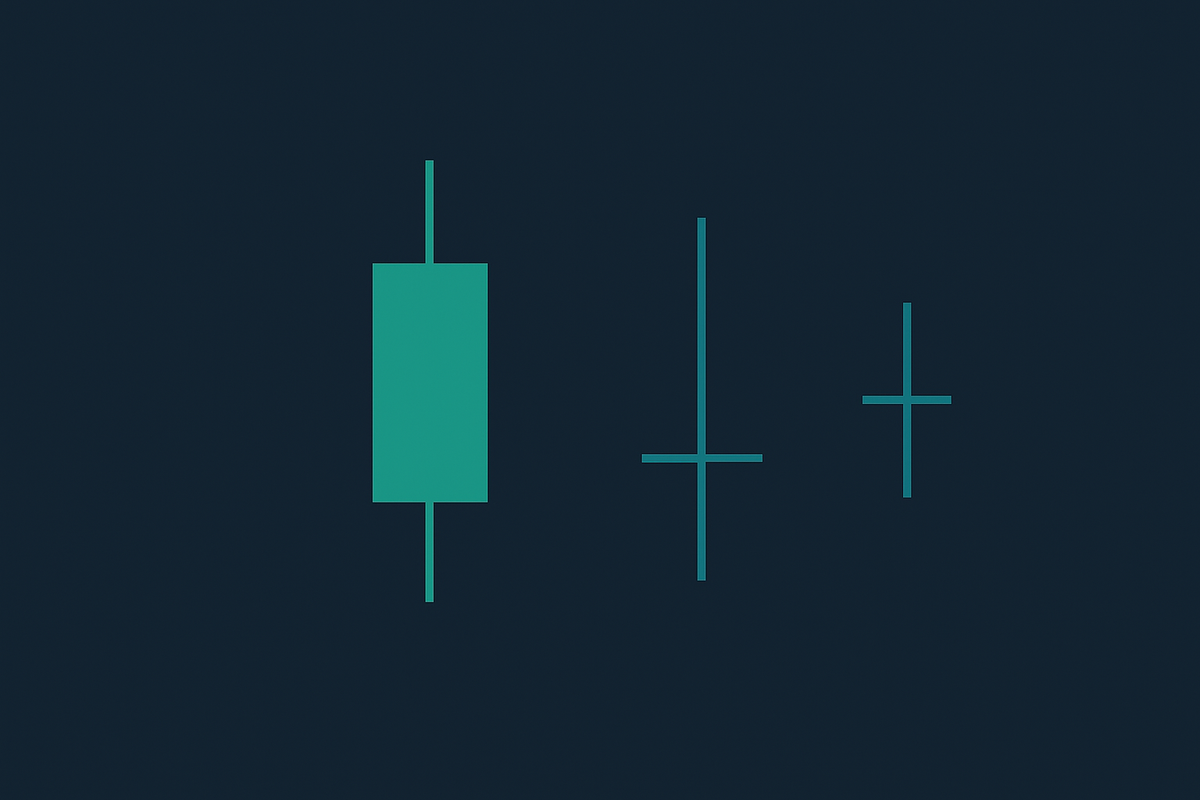
- Candle body (colored rectangle) – the difference between open and close.
- Shadows (knots) – show where the price looked during the interval, even if it did not stay there.
Bullish and Bearish candles
The color of the candle immediately tells who had the upper hand in the market:
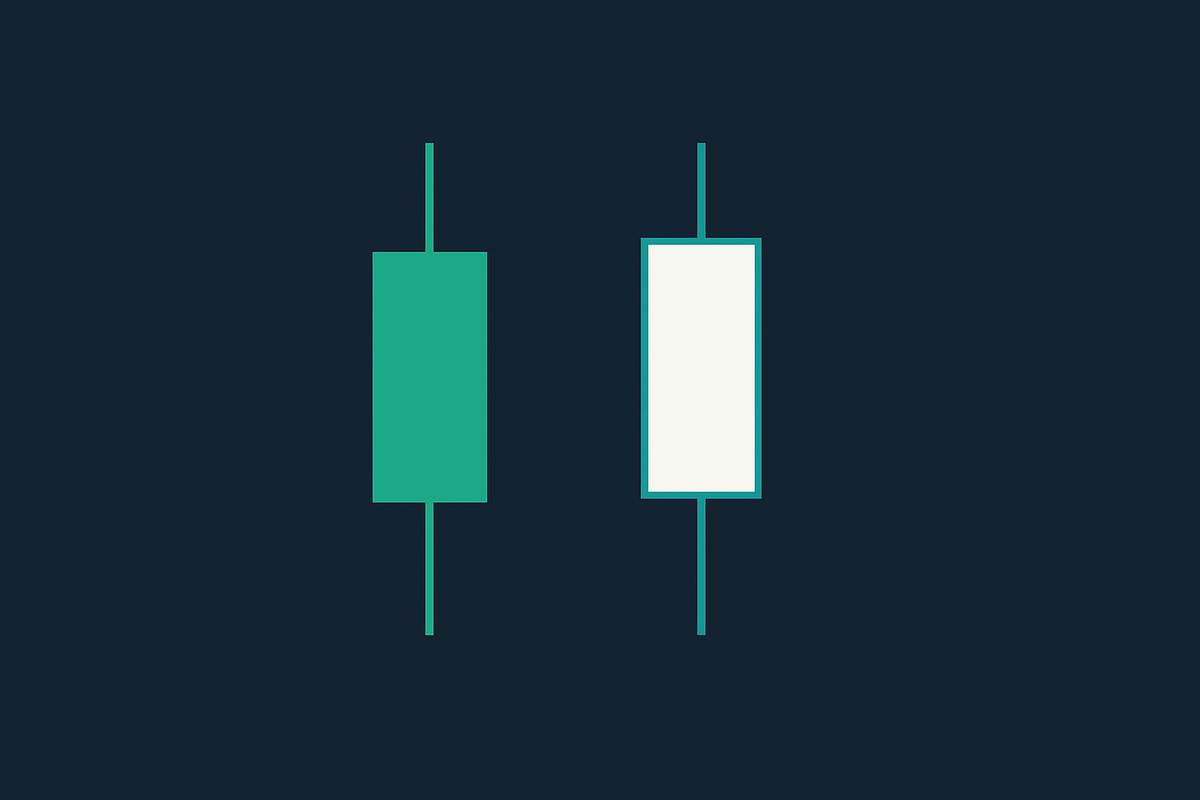
- Bullish candle (rising) – close is higher than open. Usually green or white.
- Bearish candle (declining) – close is lower than open. Usually red or black.
This simple visual information will save you time and quickly point you in the direction of the market.
Psychology behind the candles
Candle reading is not just a technical discipline – it is a window into the psychology of traders.
- Long body candle – Strong dominance of one party (buyers or sellers).
- Short body, long shadows – indecision, price fluctuated but ended near the opening level.
- Doji candle (open ≈ close) – balance of forces, often a signal of a possible reversal.
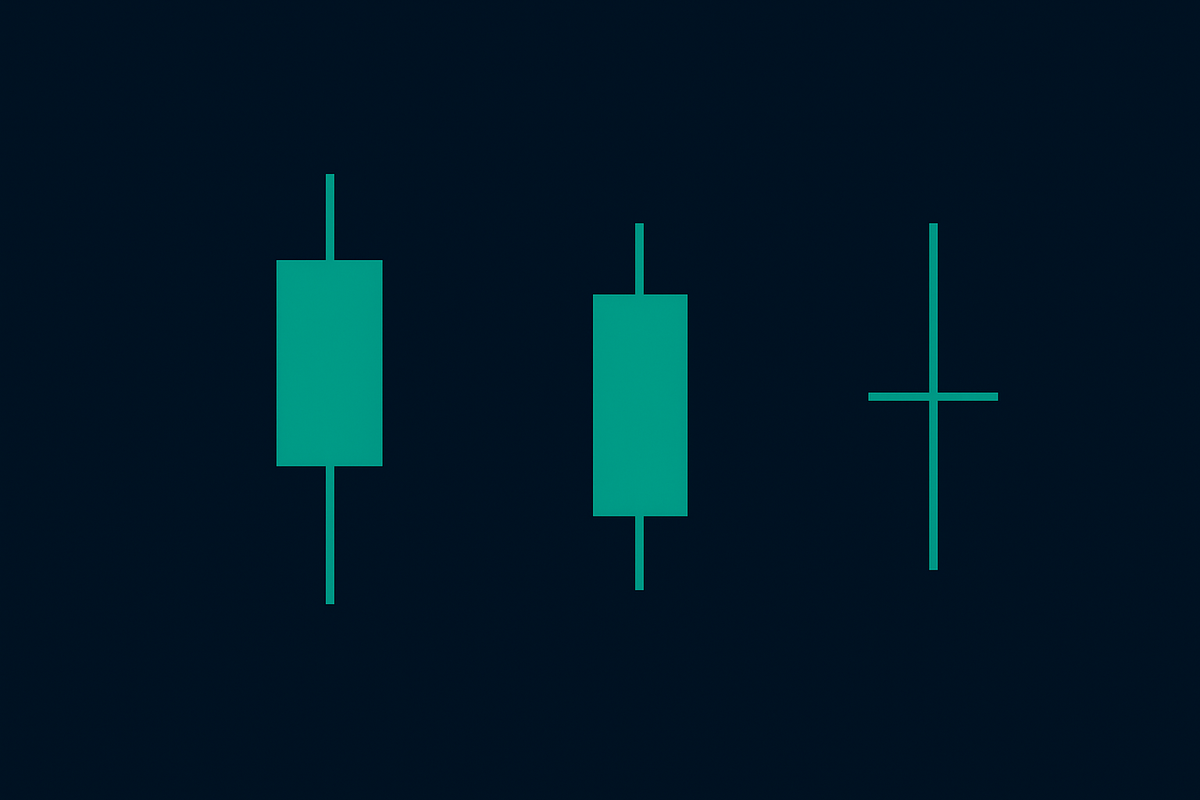
Basic candle formations
Advanced traders watch not only individual candles, but also formations of multiple candles. These can indicate the continuation or reversal of a trend.
The most common are:
- Hammer (hammer) – small body, long lower wick → buyers refused to drop.
- Engulfing – larger candle absorbs the previous one → strong reversal signal.
- Doji – expresses indecision, often before a change in trend.
Practical tip for beginners
Beginning traders often make the mistake of trying to learn dozens of complex formations right away. The right way is different: understand the logic of each candle and what they say about buyers and sellers. Once you master this principle, the whole chart will start to make more sense to you.
Summary
Reading candles in trading allows you to:
- quickly understand who has control of the market,
- identify possible trend reversals,
- improve the accuracy of your technical analysis.
It is the first step to move from beginner to professional trader.