· By Ondrej Kavalek
How to trade by candlestick formations?


Candle formations as the basis of trading
If you are new to trading, one of the first steps should be to understand candlestick formations and their role in price charts. This article will introduce you to the basics of candle formations and offer guidance on how to use them in a complete trading strategy.
What are candle formations?
Candle formations are a visual representation of price movements in financial markets, formed by individual candles on candle charts. These formations are not just random patterns, they reflect the sentiment of traders, their decisions, hopes and fears. The history of candle charts dates back to the 18th century when Japanese traders started using them, especially in the rice markets. These charts were developed by Muneshima Homma, a trader from the city of Sakata. Today, candlestick charts are widely used around the world.
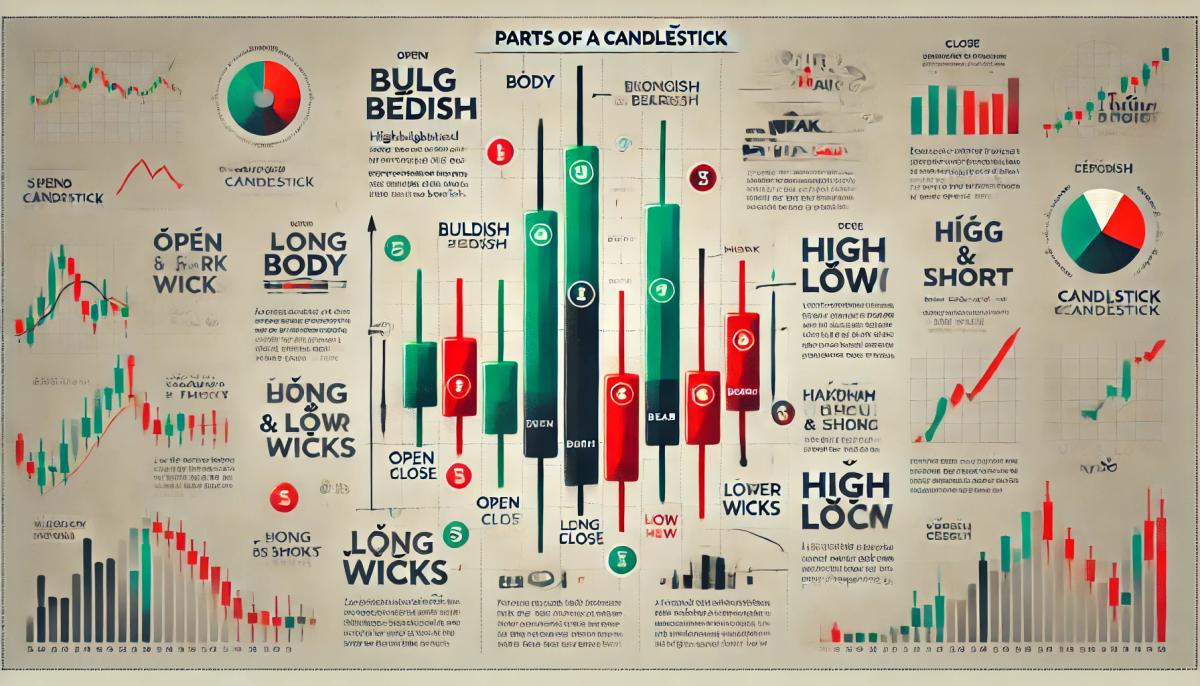
Description of individual parts of the candle
Each candle on the chart consists of a body and a wick, and displays four basic prices: opening, closing, maximum and minimum. The color of the candle body indicates the direction of price movement during a given time period: green (bullish) indicates a price increase, while red (bearish) indicates a decrease. The size of the body indicates the strength of the movement: a long body indicates a strong trend, while a short body indicates uncertainty. The shadows (wicks) of the candles then show how far the price has reached during the period before pulling back.
Why are candle formations important?
Analyzing candlestick formations is a key part of technical analysis that is popular among traders in the financial markets. Technical analysis relies on historical data to help traders estimate future price movements. For example, a bullish engulfing formation can signal a potential market rise.
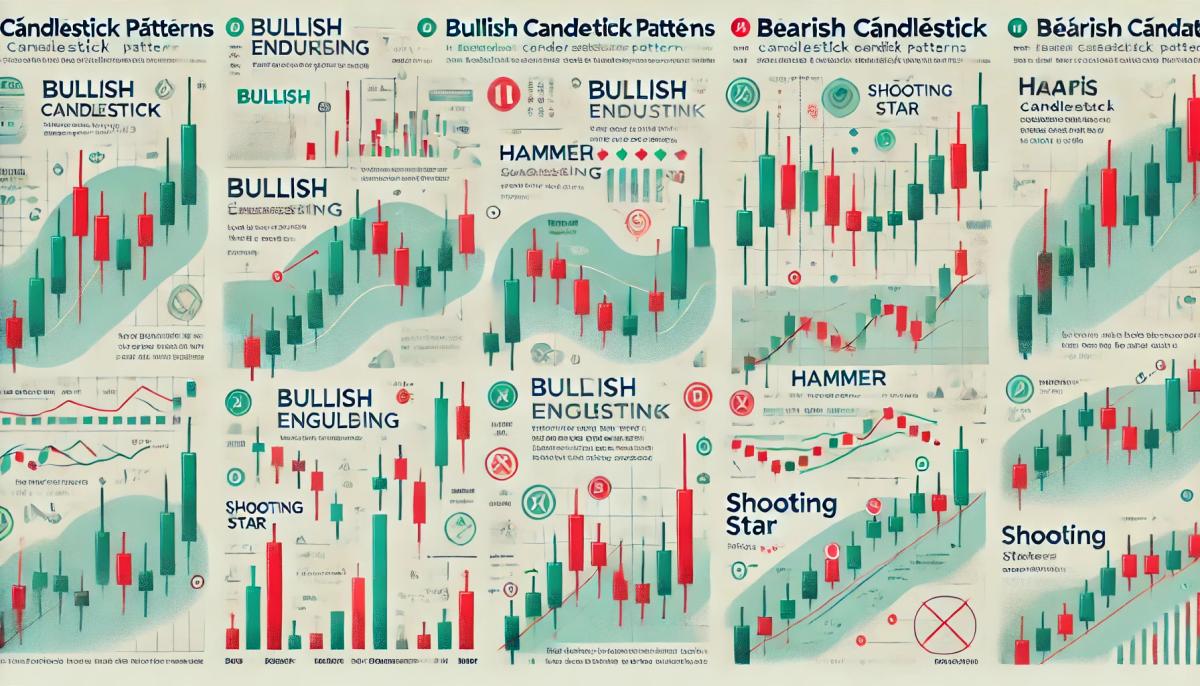
Basic types of candle formations
Bullish candle formation
Bullish formations symbolize traders’ optimistic outlook, their belief in market growth and their willingness to push prices higher. This mentality is often driven by the hope for economic growth, positive news or the belief that a particular asset is undervalued. Basic bullish candlestick formations include:
Bullish engulfing: This formation occurs when a small red candle is followed by a large green candle that completely engulfs the body of the previous candle.
Hammer: The short body and long lower shadow suggest that the bears pushed the price down, but the bulls were able to push it back up.
Bear candle formation
Bearish formations signal a pessimistic view of traders, their fear of a market decline and a tendency to sell assets. The basic bearish formations include:
Bearish engulfing: This formation occurs when a small green candle is followed by a large red candle that completely engulfs the body of the previous candle.
Shooting star: It has a short body and a long upper shadow, indicating that the bulls pushed the price up, but the bears were able to push it back down.
Continuous Candle Formation
These formations signal a continuation of the trend. The most common ones include:
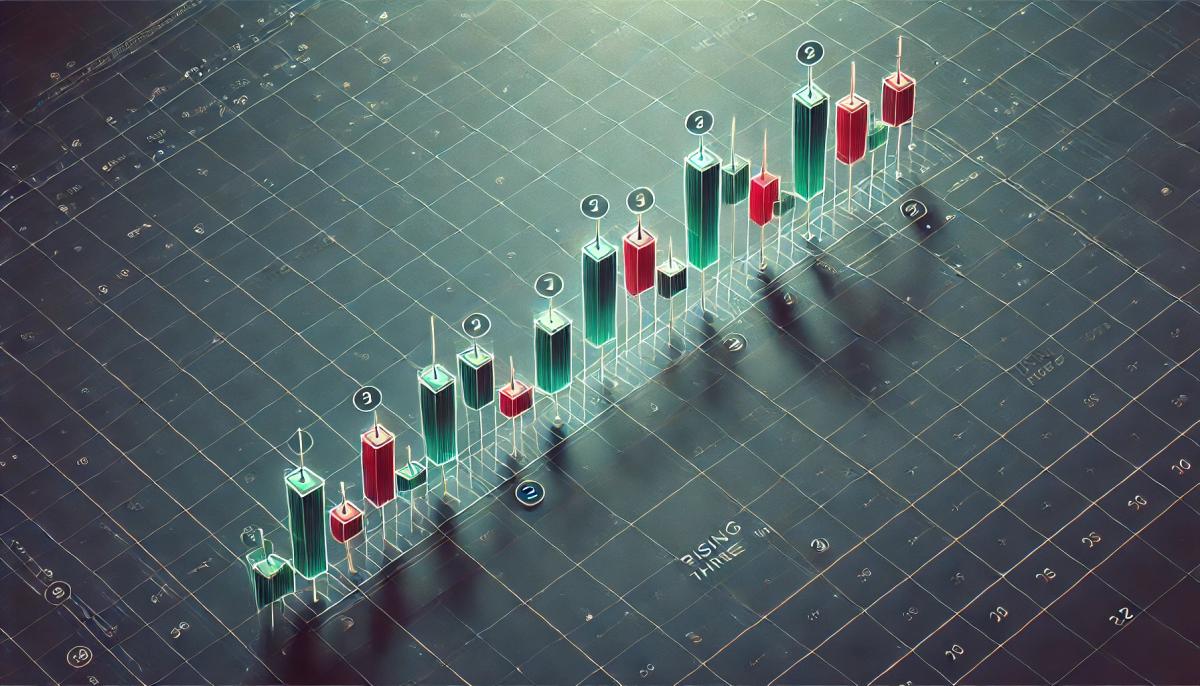
Rising three methods: It consists of a long green candle followed by several small red candles and another long green candle.
Falling three methods: Reverse formation to Rising Three Methods, indicating a continuing downtrend.
Trading strategies using candlestick formations
A trading strategy using candlestick formations can be very effective if applied correctly. Here is a simple example of the strategy:
Formation identification: Watch the charts and identify potential candle formations that signal a reversal or continuation of the trend.
Confirmation of trend indicators: Use other technical indicators, such as moving averages or RSI, to confirm the signal.
Input signal: When a confirmed formation appears, open a trade in the direction of the indicated trend.
Stop Loss and Take Profit: Set the stop loss to the support/resistance level and the take profit to the predetermined profit target.
Learn to trade with candle formations
Candle formations are an important tool in every trader’s arsenal. Understanding and using them correctly can greatly increase your chances of success in trading. Remember that candle formation analysis should be combined with other analytical tools for best results. In future articles, we will take a closer look at the different types of candle formations and strategies to trade them effectively.
We are a Czech prop firm and have been in business since 2021. We offer support in Czech from 10am to 10pm and an intuitive trading platform, EverStation Pro, which is integrated with TradingView. In our platform you will get access to cutting-edge analytical tools and educational materials for your development. Join our global network of over 3,000+ satisfied traders. With us, you’ll get fast payouts, within a maximum of 7 hours. Choose a program according to your criteria, pass the Verification and trade for EverTrader.