· By Ondrej Kavalek
How to Use the Bollinger Bands Technical Indicator?
What are Bollinger Bands?
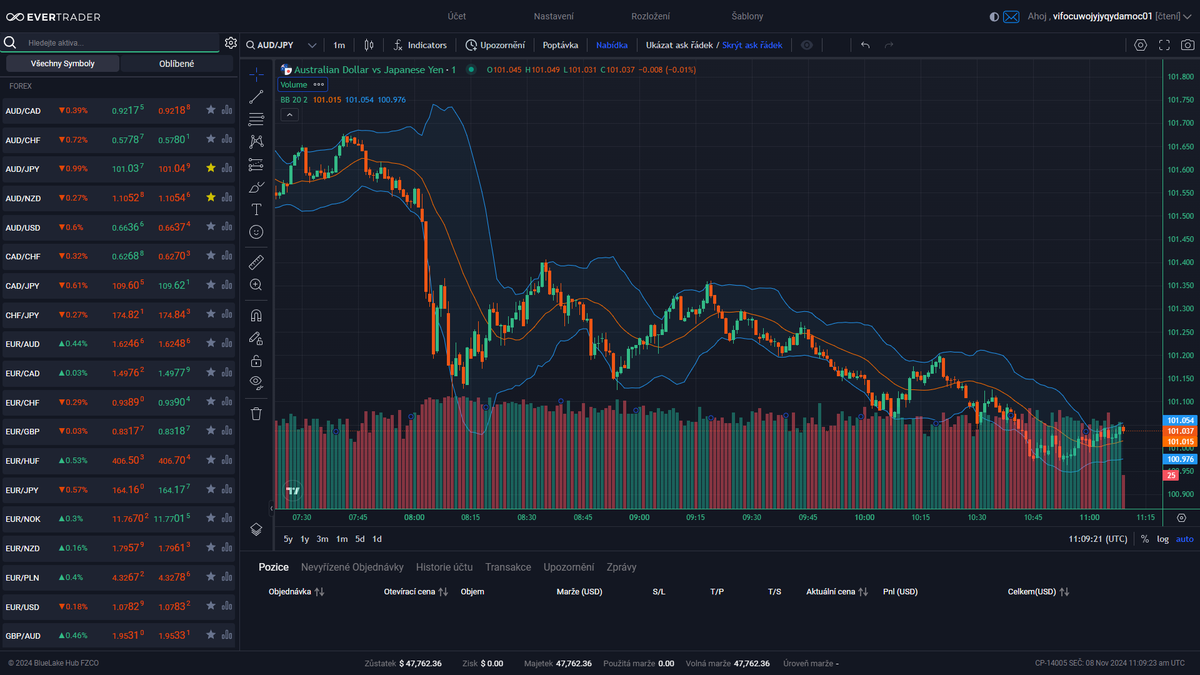
Bollinger Bands are widely used technical indicators in technical analysis, known both to professional and private investors. Developed by John Bollinger, this indicator primarily aims to measure market volatility and provide traders with information on potential trend reversals and continuations. It consists of three lines:
- The middle line represents the average price over a specified period.
- The upper band is defined as two standard deviations above the middle line.
- The lower band is defined as two standard deviations below the middle line.
How to Interpret Bollinger Bands?
Interpreting Bollinger Bands is key to their effective use:
- Overbought Market: When prices move close to the upper band, the market is considered overbought. This often indicates that prices are overvalued and may decline.
- Oversold Market: When prices move close to the lower band, the market is considered oversold, which may indicate undervalued prices that might rise.
- Stable Market: When prices move between the upper and lower bands, the market is considered stable.
Bollinger Bands can be applied across different timeframes, from minute to weekly charts, allowing traders to identify various trading opportunities.
How to Use Bollinger Bands in Trading?
Bollinger Bands offer several strategies for effective use in trading:
- Trend Trading: Bands can help identify ongoing trends. If prices rise toward the upper band but haven’t reached it yet, it may indicate an upward trend. Conversely, if prices fall toward the lower band without reaching it, it may indicate a downward trend.
- Mean Reversion Trading: This strategy uses Bollinger Bands to identify market reversals. If the market is consolidating and prices move above the upper band, it may signal selling, as the market is overbought. If prices drop to the lower band, it may signal buying, as the market is oversold.
- Combining with Other Indicators: Bollinger Bands can be combined with other technical indicators to improve trading signal accuracy:
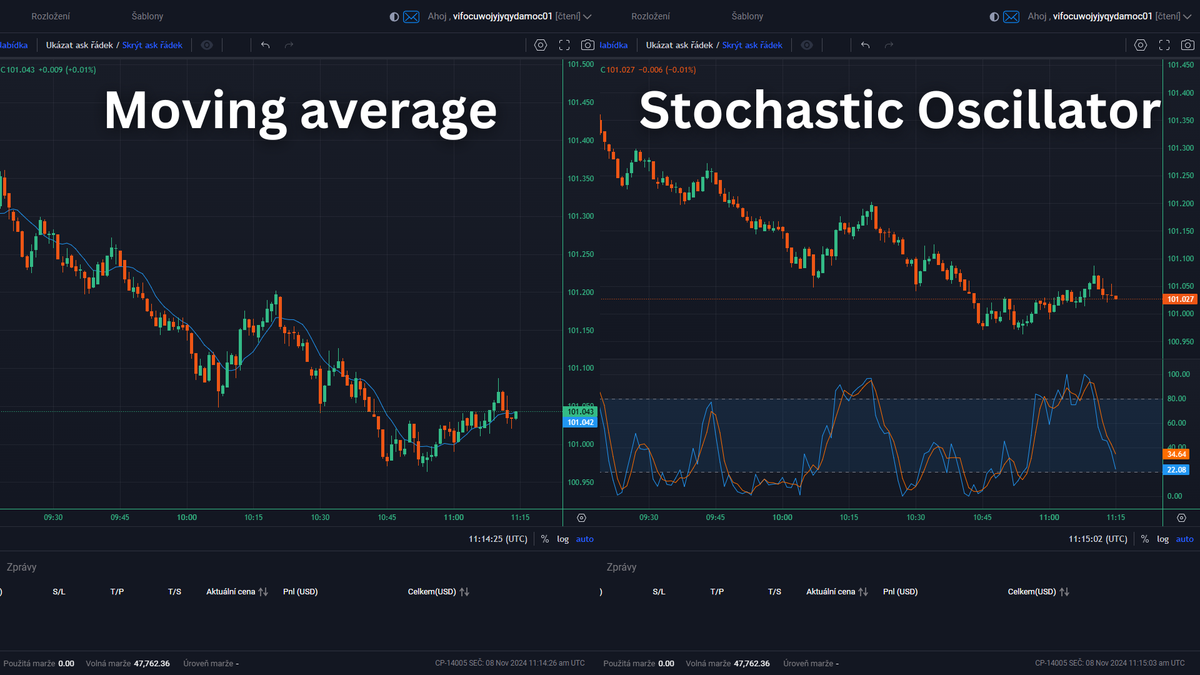
- Moving Average: When prices move above the moving average and simultaneously above the upper Bollinger Band, it may signal a continuing uptrend.
- Stochastic Oscillator: If the Stochastic Oscillator values exceed 80% and prices are above the upper Bollinger Band, it can indicate an overbought market, signaling a potential decline.
Advantages and Disadvantages of Bollinger Bands
Using Bollinger Bands has its pros and cons. Key advantages include their simplicity and ability to provide clear trading signals. However, as with any technical indicator, Bollinger Bands have limitations and may generate false signals. It is essential to use them in combination with other analytical tools and maintain thorough risk management.
Bollinger Bands are a valuable tool in the technical analyst’s arsenal. Their simplicity and effectiveness can help investors better understand market dynamics and make more informed trading decisions. Bollinger Bands can significantly improve the success rate of your trading strategies.
If you’re ready, sign up for EverTrader Evaluation and gain all the tools a professional trader needs, including education and the opportunity to trade for a prop firm on an EverAccount with up to 1 million USD. Learn trading on our EverStation Pro platform, integrated with TradingView.
Start your trading journey with us and discover the potential financial markets offer. Success is closer than you think. Visit us at EverTrader and join a community of successful traders.