· By Ondrej Kavalek
MACD: A key technical analysis tool
Indicator MACD: Moving Average Convergence Divergence
The MACD (Moving Average Convergence Divergence) indicator is one of the most widely used and reliable technical analysis tools. Its popularity ranks just behind the RSI indicator and its history dates back to the 1970s. MACD is an oscillator that works with moving averages and helps traders determine the direction and strength of the trend, which is crucial for confluence analysis. In this article, we will take a closer look at the structure, characteristics and practical use of MACD.
What is MACD?
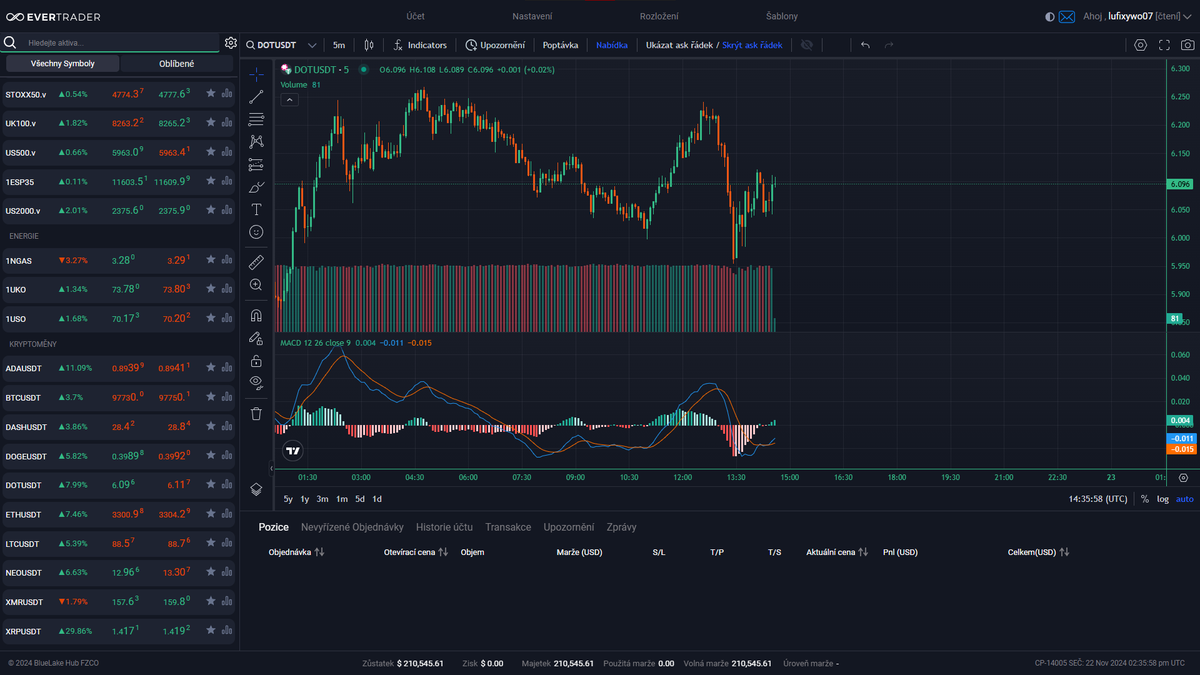
MACD (Moving Average Convergence Divergence) is a trend-following oscillator that shows the relationship between two moving averages of the price of a security. It is created by subtracting the value of the long-term exponential moving average (usually 26 periods) from the short-term moving average (usually 12 periods). The indicator consists of two lines and a histogram.
Structure of the MACD indicator
Main line (MACD line) – blue color: It is formed as the difference between the value of the long-term and short-term exponential moving average.
Signal line – red colour: This is the moving average (usually with a period of 9) of the main MACD line.
Histogram: Shows the difference between the main and signal lines and oscillates around the zero line, which represents the long-term moving average.
Practical Uses of MACD
Visualisation of trends
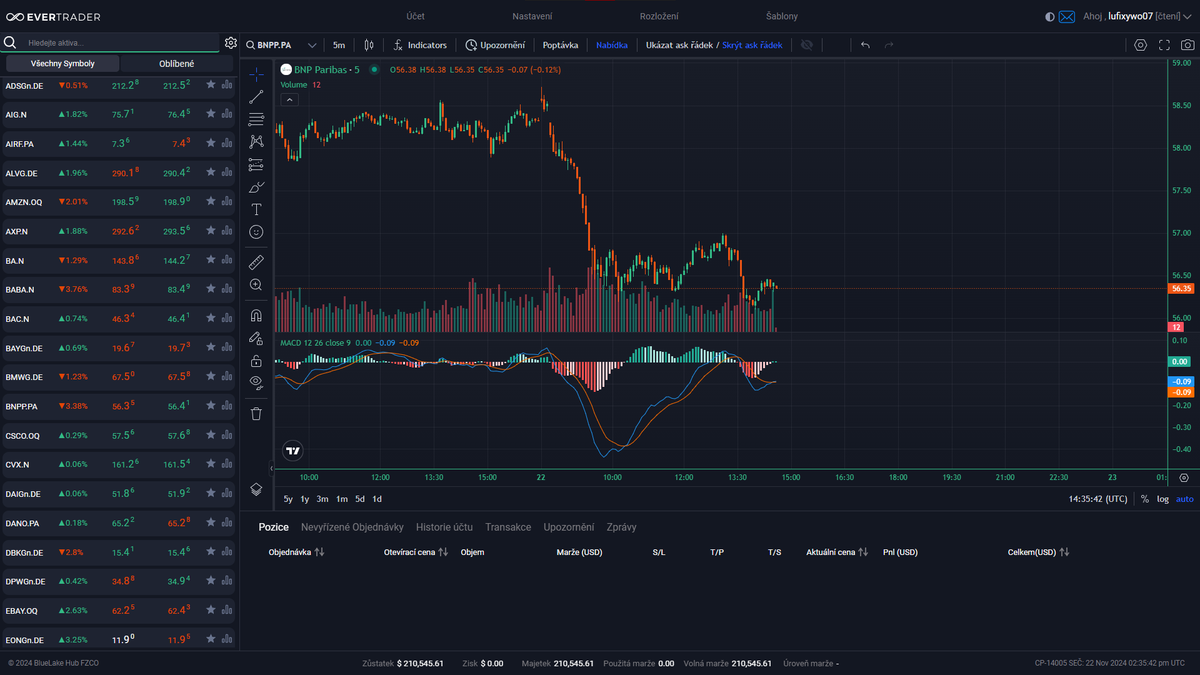
One of the most important functions of MACD is to visualize the current trend and its strength. If the main line (blue) is rising, it means that the market is in an uptrend. Conversely, if the main line is falling, the market is in a downtrend. The histogram then provides information about the strength of that trend – the higher the histogram value, the stronger the uptrend, and vice versa.
Generating trading signals
MACD is also very effective in generating trading signals:
Buying signal (Bullish Cross): When the main line rises above the signal line, it is a signal to buy.
Sell signal (Bearish Cross): When the main line drops below the signal line, it is a sell signal.
The strength of these signals increases the further the intersection of the two lines is from the zero line. An additional intersection of the zero line can be considered as a confirmation of the signal.
Search for divergences
MACD can also be used to look for divergences, which can be an indicator of trend change:
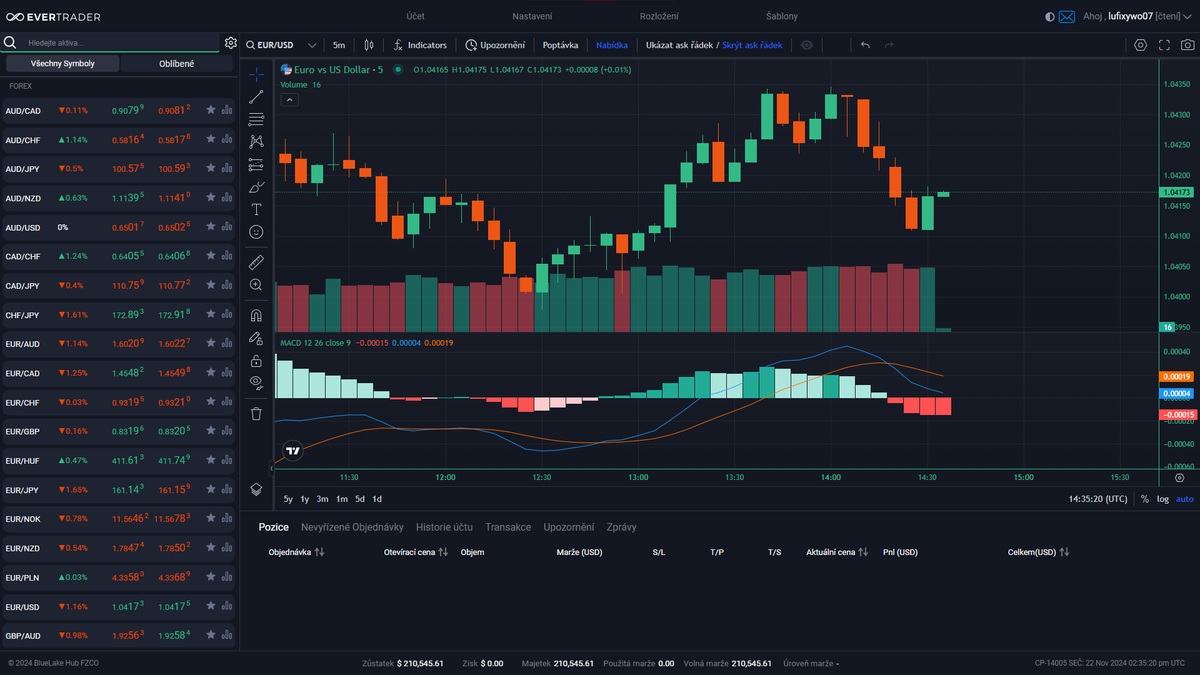
Bullish divergence: When price makes lower lows but the MACD histogram makes higher lows.
Bearish divergence: When price forms higher peaks but the MACD histogram lower peaks.
Divergences can indicate potential trend reversals and are a useful tool in analyzing market conditions.
How to use MACD indicator for successful trading?
The MACD indicator is an essential tool for every trader engaged in technical analysis. Its ability to determine the direction and strength of the trend, generate trading signals and identify divergences makes it one of the most reliable and effective indicators on the market. Although it is especially popular among beginners, proper use of MACD requires practice and combination with other analytical tools for best results.
If you’re ready, take the EverTrader Verification and get all the tools you need to be a professional trader. We offer education and the opportunity to trade for a prop firm on EverAccount with a capital of up to 5 million CZK. Our EverStation Pro platform is integrated with TradingView and provides you with everything you need for successful trading.
Start your trading journey with us and discover the potential that financial markets offer.