· By Ondrej Kavalek
(MUST KNOW) How do moving averages work?
Moving Averages (MA)
Moving averages are a popular tool among many traders and investors. They help identify current trends, potential turning points in price charts, and optimal entry and exit points. What types of moving averages exist, what should you watch out for, and how can you use them effectively?
What Are Moving Averages?
These indicators are among the most basic and widely used tools in technical market analysis. They serve as a statistical measure used to smooth out price data and identify trends in financial markets. The principle involves calculating the average price or other indicator over a specific time period and advancing it forward with each new trading day or interval.
Types of Moving Averages
Moving averages vary primarily based on their calculation methods. The most common types include:
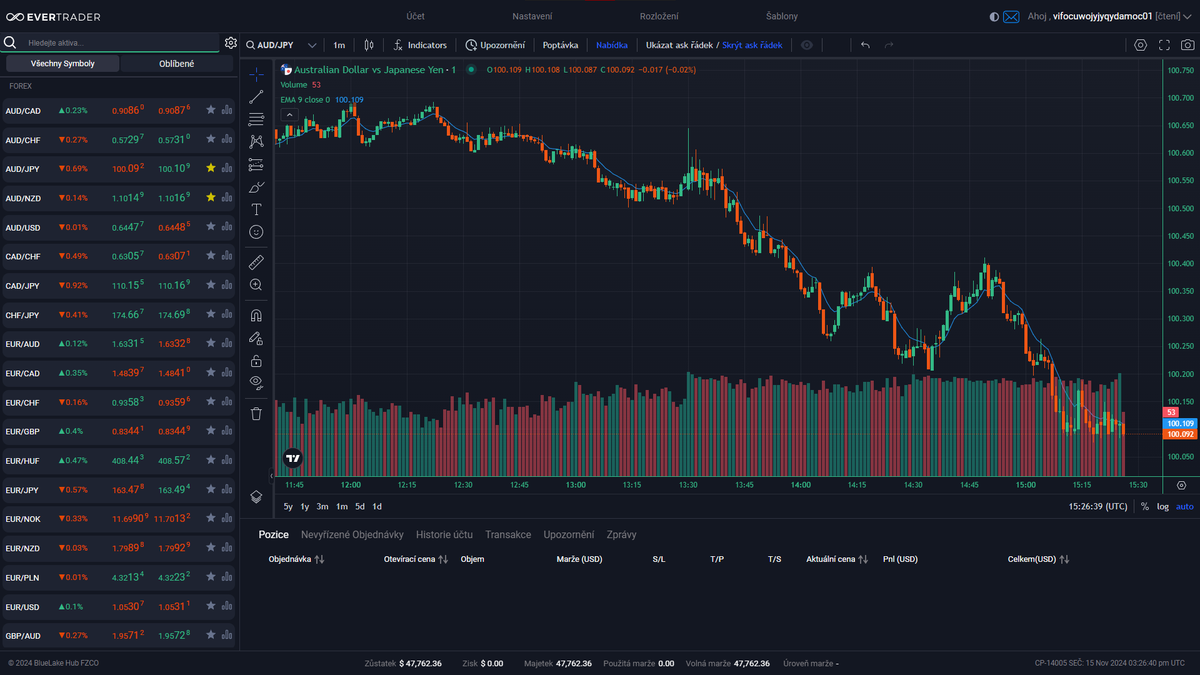
Simple Moving Average (SMA): The SMA calculates the arithmetic average of price data over a specific period. For example, a 10-day SMA averages the prices from the past 10 days, while a 50-day SMA does the same for the last 50 days. It provides an evenly weighted perspective on historical prices.
Exponential Moving Average (EMA): The EMA assigns greater weight to recent data, responding more quickly to current market conditions than the SMA. This weighted average diminishes exponentially with older data, making it more sensitive to price changes and trends.
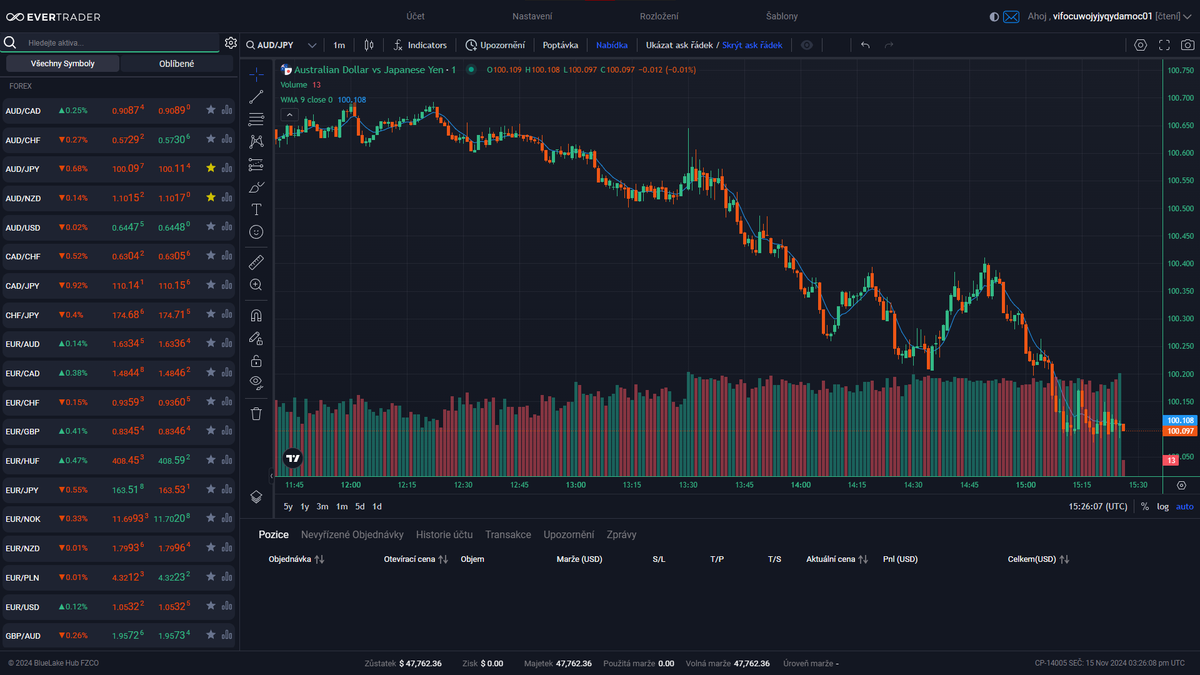
Weighted Moving Average (WMA): Unlike the SMA, which gives equal weight to all data, the WMA assigns varying weights to data points, often prioritizing more recent data. This flexibility allows traders to tailor the WMA to market-specific conditions.
Short-Term vs. Long-Term Moving Averages
Traders often distinguish between short-term and long-term moving averages, particularly when using two or more lines with different periods. Short-term MAs react faster to price changes, while long-term MAs are slower. Traders frequently use their relationship (e.g., crossovers) for signals.
Choosing the Right Period for Moving Averages
There’s no universal period that fits all strategies. Selection depends on your trading goals, strategy, and preferences. Shorter periods suit quick market movements, while longer periods are better for analyzing long-term trends. Testing and backtesting are essential to determine what works best for your trading style.
How to Use Moving Averages in Trading
- 1. Identifying TrendsMAs can confirm market trends. For instance:2. Detecting Trend ReversalsWhen the price meets or crosses the MA line, it may signal weakening momentum or a potential trend reversal.3. Timing Entries and ExitsMAs can act as dynamic support or resistance levels. Traders may also use them to gauge how far prices deviate from the MA for timing entries.4. Using Crossovers
- An upward-sloping line suggests an uptrend.
- A downward-sloping line indicates a downtrend.
- Prices above an MA suggest bullish sentiment; below suggest bearish.
- Golden Cross: A short-term MA crossing above a long-term MA often signals a buy.
- Death Cross: A short-term MA crossing below a long-term MA may signal a sell.
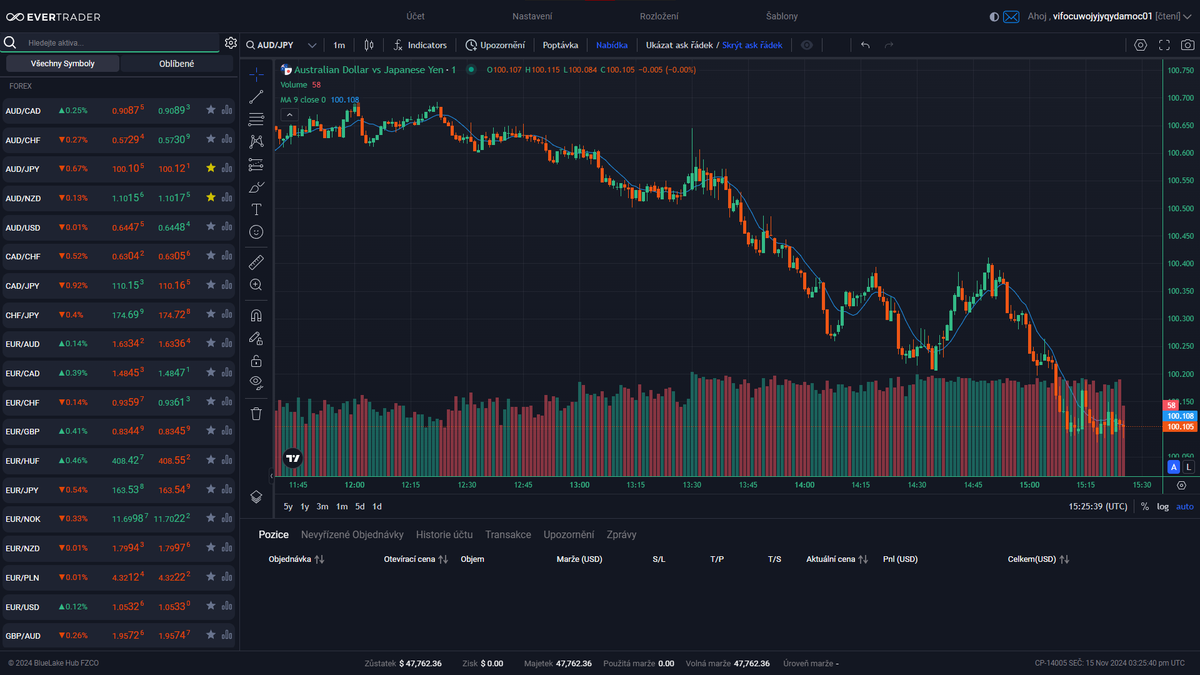
Limitations of Moving Averages
MAs rely on historical data, meaning they inherently lag and may generate delayed or false signals, particularly during volatile periods. Thus, they should be used alongside other indicators for a well-rounded strategy.
Conclusion
Moving averages are invaluable tools for simplifying complex price data, identifying trends, and making informed trading decisions. However, no indicator is flawless. Proper usage, combination with other tools, and ongoing strategy adjustments are key to success.
Start your trading journey with EverTrader and unlock the potential of financial markets. Join our community of successful traders today!