· By Ondrej Kavalek
RSI: The most popular technical indicator
RSI: Relative Strength Index
RSI, or Relative Strength Index, is one of the most popular technical indicators used in analyzing price charts in financial markets. This oscillator, which has been in use for approximately 40 years, is popular due to its simplicity and effectiveness. The RSI was first introduced in 1978 by J. Welles Wilder, a mechanical engineer who became famous as a technical analyst.
Basic principles of RSI
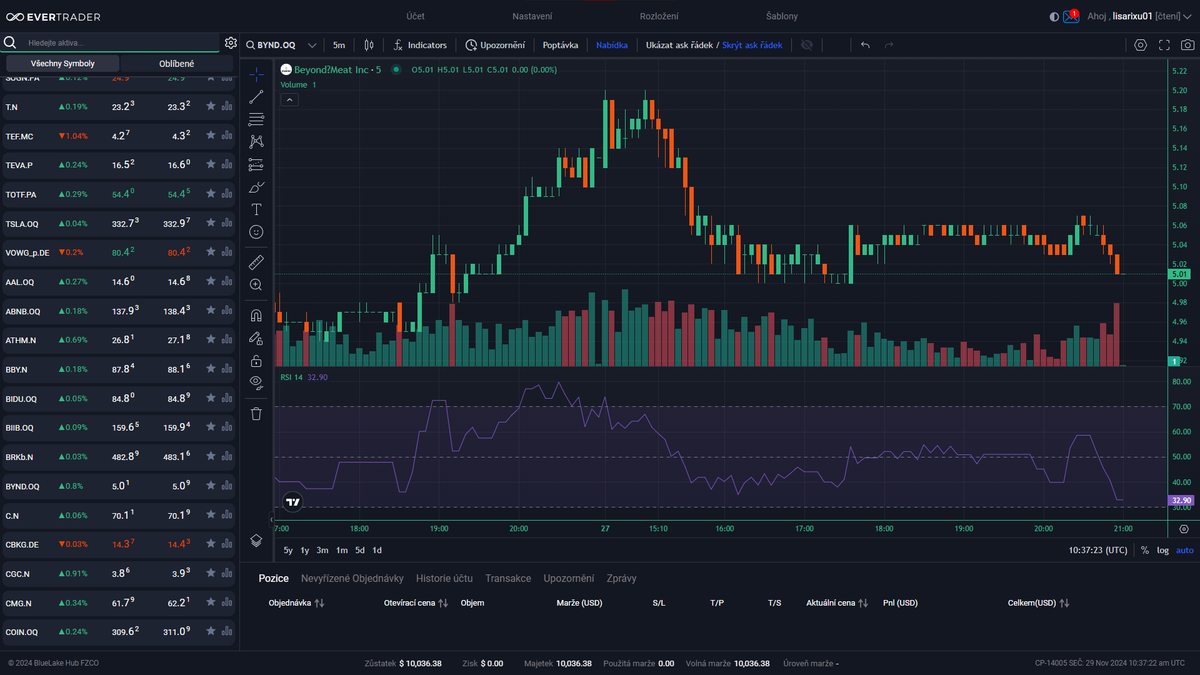
The RSI is a technical indicator that measures the speed and strength of an asset’s price movement based on its closing prices in the last trading period. RSI values range from 0 to 100 and help identify potential price reversals. Values below 30 indicate an oversold condition, while values above 70 indicate an overbought condition.
Characteristics of RSI
The RSI is classified as a lagged indicator, which means it tracks price movement instead of predicting it. This indicator is composed of values that have a range of 0 to 100 points, and its basic setup is based on 14 trading periods. This means that the last 14 candles in the price chart are taken into account when calculating the RSI. Some analysts may adjust this period, but the standard setting according to Wilder is 14 periods.
Using RSI in practice
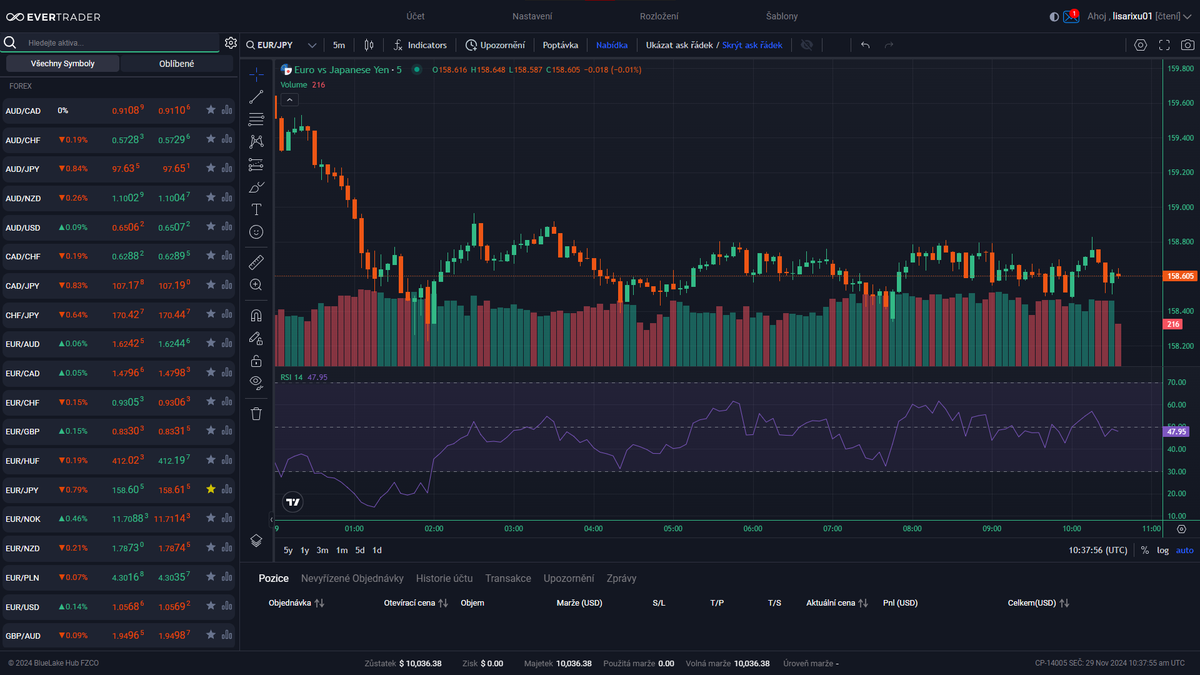
RSI is used not only to identify oversold and overbought conditions in the market, but also to identify other key signals such as divergences. Divergences occur when the price of an asset and the RSI values show divergent trends.
Overbought and oversold areas
Defining overbought and oversold areas is one of the most basic ways to use the RSI. Wilder defined values above 70 as overbought, which means the price is rising too fast and a correction can be expected. Values below 30 are considered oversold, indicating that the price is falling too fast and a reversal to the upside may occur.
In trends, however, RSI values can remain above 70 or below 30 for an extended period of time until the trend loses its strength. Therefore, traders often wait for the RSI to return below 70 in the case of a strong uptrend before considering selling, or wait to test the 70 level in the case of a downtrend.
Search for divergences
Another method is to look for divergences between the price chart and the RSI indicator chart. A divergence occurs when the price reaches a new high or low, but the RSI does not confirm this movement. If the price shows a new high but the RSI does not, this is considered a sell signal. This signal can also be used to buy if it appears in the opposite situation (above or below 50).
Graphic Pattern Search
RSI can also create different graphical patterning such as Head and Shoulders, Double Bottom, Triangle or Double Top which are not visible on the price chart. For example, a Head and Shoulders pattern on the RSI can signal a market reversal. Traders should enter the market on the right shoulder of the patter and get confirmation of the patter when the neckline is broken.
Drawing trend lines
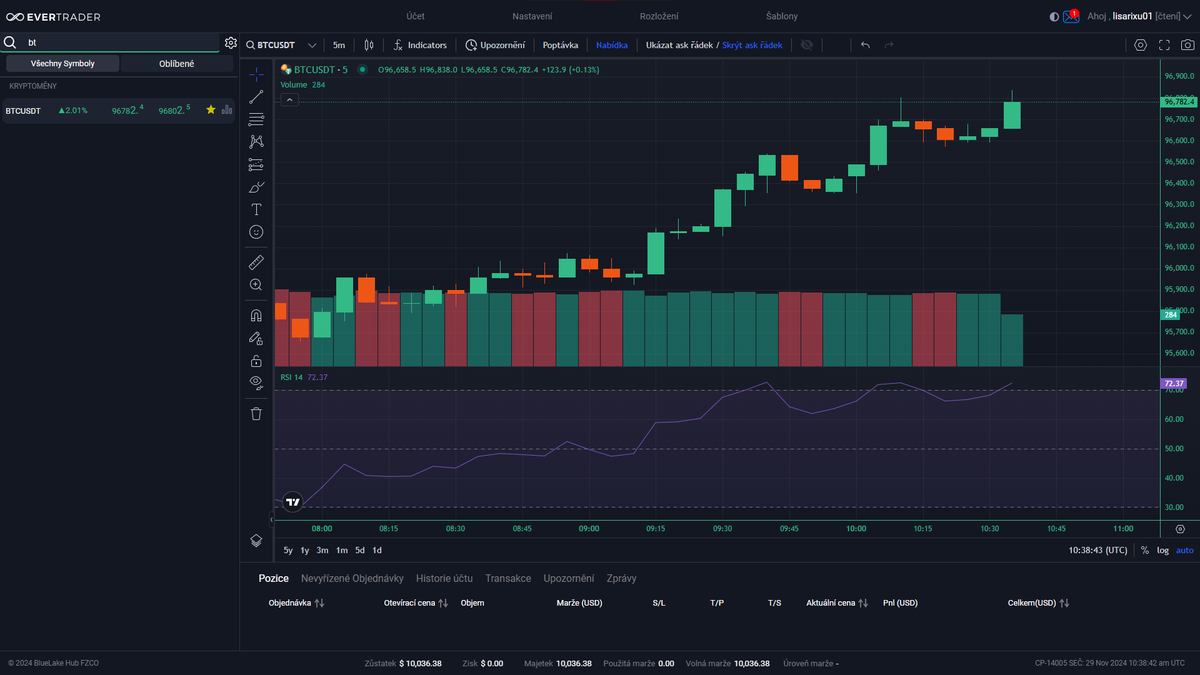
Drawing trend lines on the RSI is another useful technique. Trend lines can serve as supports and resistances. If the RSI readings break a trend line, traders can draw the same line on the price chart and wait for it to test, which can provide a signal to enter the market.
Failure of the swing turnaround patter
Failure of the swing reversal patter is another method that can be used with RSI. This technique involves identifying patterns that do not form correctly, which can provide additional confirmation for trading decisions.
Other trading strategies with RSI
RSI can also be used to signal price breaking out of a trading range (range). The trader chooses a certain RSI level (for example, 70) and waits until the price moves near the upper edge of the range and the RSI line reaches that level. This may signal that the price will break higher out of the range. Similarly, for a breakout to the downside, the trader selects an RSI level in the oversold area (for example, 30) and waits for the RSI to descend below that level.
The advantage of this strategy is that in the event of an actual breakout, the trader will be in position from the beginning of the price swing. The disadvantage is the risk of a false breakout and thus a false signal.
Use RSI to maximize the value of your trading strategy
The RSI indicator is a versatile technical analysis tool that offers various methods of use for identifying price reversals and trends. Traders can use overbought and oversold areas, divergence search, chart patterns, trend line drawing and failed swing reversal patterns to create effective trading strategies. It is important to combine RSI with other technical analysis tools to confirm signals and minimize the risk of false signals.
Do you accept the challenge and pass the EverTrader Verification? Get all the tools you need for professional level trading. We offer education and the opportunity to trade for a prop firm on EverAccount with a capital of up to 5 million CZK. Our EverStation Pro platform is integrated with TradingView and provides you with everything you need for successful trading.