· By Ondrej Kavalek
Why 95% of Traders FAIL (Don’t Be One of Them!)
Identification of key market trends, supports and resistances
Support and resistance (S/R levels) are among the most important concepts in technical analysis and form the cornerstone of every trader’s toolbox. While they may seem simple at first glance, their proper understanding and application can greatly improve your trading decisions. These levels are not just technical formations, but also psychological barriers that influence traders’ behavior in the market.
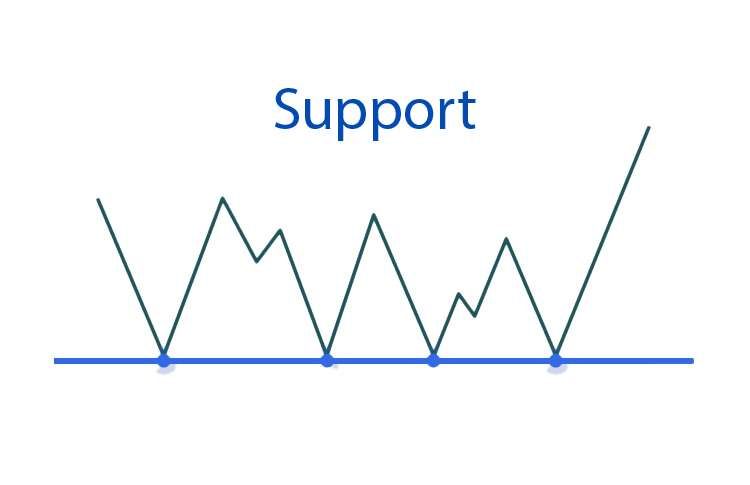
Support (support, bottom)
Support refers to the price area where the price tends to stop and bounce back up. This level represents the lower limit where traders consider the price low enough to stop selling, which leads to a halt in the decline and subsequent rise in price. The more often the price touches this level and bounces, the stronger the support given. If the market breaks through strong support, another significant decline often follows.
Resistance (resistance, ceiling)
Resistance, on the other hand, is the price level where traders refuse to buy further because the price is considered too high. This causes a halt in growth and a bounce back downwards. As with support, the more touches, the stronger the resistance. Breaking through strong resistance often leads to a significant price increase, unless it is a false breakout.

Importance of S/R levels
Supports and resistances play a key role in forming price channels that limit the sideways movement of the market. When these channels are broken, we can expect significant price movements. Many traders place their orders just at the S/R levels, which makes them areas of high trading activity. The market tends to return to these significant levels, providing technical traders with opportunities to enter and exit positions.
Analysis of S/R: is essential for successful trading. Systematically monitoring the markets and identifying these key levels will allow you to better predict future price movements. You can speculate on a price bounce or a breakout of a given level and effectively place stop losses or set profit targets.
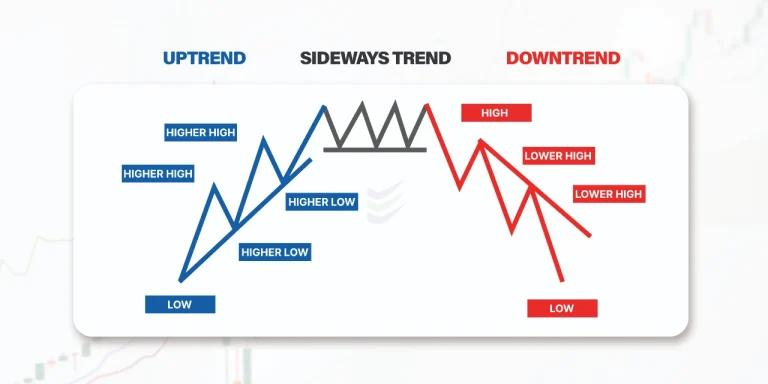
What are market trends? Trend trading is a popular style of trading that focuses on analyzing historical price movements of assets. Trends refer to the directions in which the prices of financial assets move. These trends can be either bullish, where prices continuously rise, or bearish, where they continuously fall. Sometimes the market may also stay within a certain price range, which is called a sideways (or horizontal) trend.
How does trend trading work?
Trend trading works on the assumption that the momentum of a move will cause the price trend of an asset to continue. After determining the direction where the asset’s price is going, trend traders continue in the same direction. A common assumption in trading and investing is that a rise in price will be followed by a fall. Although this often happens, it is not always the rule.
For example, historical data shows that the long-term price trend of the stock market is upward. Despite the ups and downs, some buy-and-hold investors believe this overarching trend will continue. Trends are key because they form the basis of all market gains. They indicate the dominant direction in which the market is moving in a particular time frame. It is thus the most basic principle of how to trade.
Types of markets and their trading
Rising market (uptrend)
If the market is rising, there is an opportunity to buy into the current direction. The key is to time the entry correctly to buy at the lowest price and maximise profits. Some traders will wait for a pullback (minor correction), but this can mean the risk of waiting too long and missing a suitable entry. A rising market is called an uptrend, or bull market, which is defined as a series of higher high prices and a series of higher low prices. With each passing day, price support moves to higher levels.
Declining market (downtrend)
If the market is declining, there is an opportunity to enter the market by selling the asset. In order to maximize profits, the entry must be timed to sell at the highest price. A declining market is called a downtrend, or bear market, which is defined as a series of lower maximum prices along with a series of lower minimum prices.
When to identify a trend?
When defining a trend, it is very important to focus on choosing the appropriate time frame. If we are analyzing a long-term trend, we will use longer time frames. For intraday purposes, shorter timeframes are more useful. Investment funds and other institutions follow monthly and probably annual timeframes for long-term trading. For the end trader, a weekly chart serves as a long-term benchmark.
Achieve profitable trading
Learning to recognize and exploit support and resistance is a key step to improving your trading decisions and achieving profitable trading. This basic technical analysis technique provides a solid foundation for further developing your trading skills. Trend trading is an effective method to make money in the financial markets. Beginning investors should understand the basics of trends, learn to identify rising and falling markets and pay attention to time frames. Proper timing of entries and exits, as well as understanding the psychological aspects of the markets, can lead to successful and profitable trading.
If you’re already prepared, then sign up for EverTrader Verification and get all the tools a professional trader needs, including education and the ability to trade for a prop firm on EverAccount with up to 5 million. You can now have the opportunity to earn up to 5 years of experience at EverAccount. Master trading in our EverStation Pro platform, which is integrated with TradingView.
Start your trading journey with us and discover the potential that financial markets offer. Success is closer than you think. Visit us at EverTrader and become part of a community of successful traders.